How to create LIDAR “hillshade” XYZ map tiles
[FAQ link leads here]
This page details the steps needed to create hillshade XYZ map tiles from GeoTIFF elevation data files. I wrote it as a future aide-memoire for me and as a guide for other web developers. In this particular case, the GeoTIFF files contain high resolution data generated by LIDAR surveys, but any GeoTIFF containing high resolution elevation data should work in much the same way.
Here's some reference sites which may help or give useful background information:
- Getting started with QGIS
- Making shaded relief from digital elevation models (DEMs) in QGIS
- Tiled web map
- Slippy map tilenames
The specific aim here is to produce detailed ground terrain maps from high resolution DTM (Digital Terrain Model) data, i.e. elevation data with buildings, trees etc. all filtered out but still showing features like rivers, ridges, etc. Here in England the definitive source for obtaining such data is the Defra Survey Data Download site.
I found the easiest (and free!) way to convert the data to map tiles for a small area was by using QGIS. I knew nothing about QGIS before this project, so I watched a couple of brief introductory videos to get a feel for what it can do—but this guide should cover what you need to know even if you have never used QGIS before.
Alternatively, if you need a really large area of tile coverage, then a better approach might be to investigate automating the conversions using the GDAL translator library with a scripting language. Python seems to lead the way there. I have no experience of that approach though.
So the big picture looks like this:
- Step 1: Get the LIDAR elevation data files for your area of interest as GeoTIFF files
- Step 2: Process them in QGIS to add the hillshade and turn them into XYZ map tiles which are accepted by most—if not all—JavaScript mapping libraries
- Step 3: Implement the map tiles on your site
Step 1: Obtaining the LIDAR files
LIDAR elevation data files are available from a number of sources. For the UK, LIDAR GeoTIFFs can be downloaded from the DEFRA site linked to above. The data is available for various resolutions.
I asked the Defra Data Services Platform (DSP) Service Desk as to whether I could obtain the GeoTIFF data via an API, and their response was: "We can confirm that there is no API, but we can offer SFTP access to the complete dataset. Please note that complete 1M DTM as Zip’ed GeoTIFFs is 325 GB and the 2M DTM is 101 GB". So contact them directly via email if you need a large amount (i.e. hundreds or more) of data files—that would certainly be easier than dealing with the download site.
So because I knew I only needed around 80 data files, I chose to download them. I wanted the 1m data files, each of which contains elevation data spaced at one metre intervals for a 5km by 5km area. The download site is somewhat quirky (and not a little buggy—at least on Safari on a Mac), so I have provided detailed instructions:
- Go to the Defra Survey Data Download home page—you may need to hit refresh to wake it up
- You may see a spinning wheel of doom which you can sometimes clear away by scrolling down on the page a bit, or maybe even try a different browser if it freezes on you
- Assuming it's working OK, click the Layers icon at top of the page
- Click the drop-down arrow for LIDAR Composite Catalogues
- Tick the box for LIDAR Composite DTM 2022 1m index—after a short loading delay, the map should then colour in the available tiles
- Zoom into your area of interest on the map
- Click the Download icon at the top of the page then click Draw Polygon
- Don't try to click and drag out a polygon—which I instinctively tried and failed miserably with. You have to use a single click to create each corner of a square (or other polygon) over your chosen tiles and—crucially—even though you can now see your completed polygon, you have to click the start point again in order to activate the download button. Otherwise it remains greyed-out. I can guarantee this interface was tested by exactly zero people other than the developer, who obviously presumed it was so intuitive that no instructions were needed. Well, it wasn't bloody obvious to me!
- NB: there may be a download limit in force for the session, so you may be limited to a certain amount of files in one download. But you can go back straight afterwards and do another batch.
- Unzip all the downloaded files (you will see .tif, .tfw, .xml, and various others) and put them all together into one single directory
Step 2: The QGIS Workflow
QGIS is then used to achieve the following tasks:
- Merge all the GeoTIFF files into one big GeoTIFF file
- Add that one file into a QGIS as a raster layer
- Add a hillshade effect to the layer
- Save the hillshaded layer as a GeoTIFF file (this step is needed as explained later to work around what seems to be a bug)
- Bring the saved GeoTIFF into QGIS as a new layer and use that to export the XYZ tiles for use in your mapping software
(I should mention that all of the steps below can be automated by using Python scripts within QGIS. I wasn't making enough tiles to bother with learning GQIS scripting, but it's there as an option.)
There are various ways to create a hillshade in QGIS, but for my particular need I found the symbology method (as explained below) produced the best-looking image for detailed terrain maps under foliage etc. My aim was to choose the best method to show up the remains of buildings and similar low-level artefacts.
So, for the sake of completeness, here's the various hillshade methods I tried out:
- Right-click layer -> Properties -> Symbology -> Render Type -> Hillshade
- Processing Toolbox -> Raster terrain analysis -> Hillshade
- Processing Toolbox -> GDAL -> Raster analysis -> Hillshade
- Plug-in: Terrain Shading (downloadable option)
- Plug-in: Batch Hillshader (downloadable option)
These methods all produce slightly different hillshades which may suit better for other purposes, but for my purpose the Symbology approach offered the most options for getting the look I wanted. The other methods (for my particular use case) were either too contrasty, too washed out, not detailed enough, too blurry when zoomed, or didn't have enough options for tweaking the look. YMMV, so you should try some of the other methods to see if they suit your needs better.
QGIS Step-By-Step
Note: The hillshade styling requires a metric projection, which the British National Grid is. For other projections in degrees (which most of them are), please see Morgan Hite's excellent detailed explanation at his The Wandering Cartographer site: Making shaded relief from digital elevation models (DEMs) in QGIS. Follow the instructions there to re-project accordingly. Sorry to be so hand-wavy here, but that's not a step I needed to do, so I haven't tried it myself. Then wherever you see me referring to the British National Grid here, substitute your own metric projection accordingly.
Open QGIS. Ensure the Processing Toolbox is visible on the right-hand side by checking that Toolbox is ticked in the Processing menu.
Merge your GeoTIFF files
Merge the unzipped GeoTIFF files into one big file as follows:
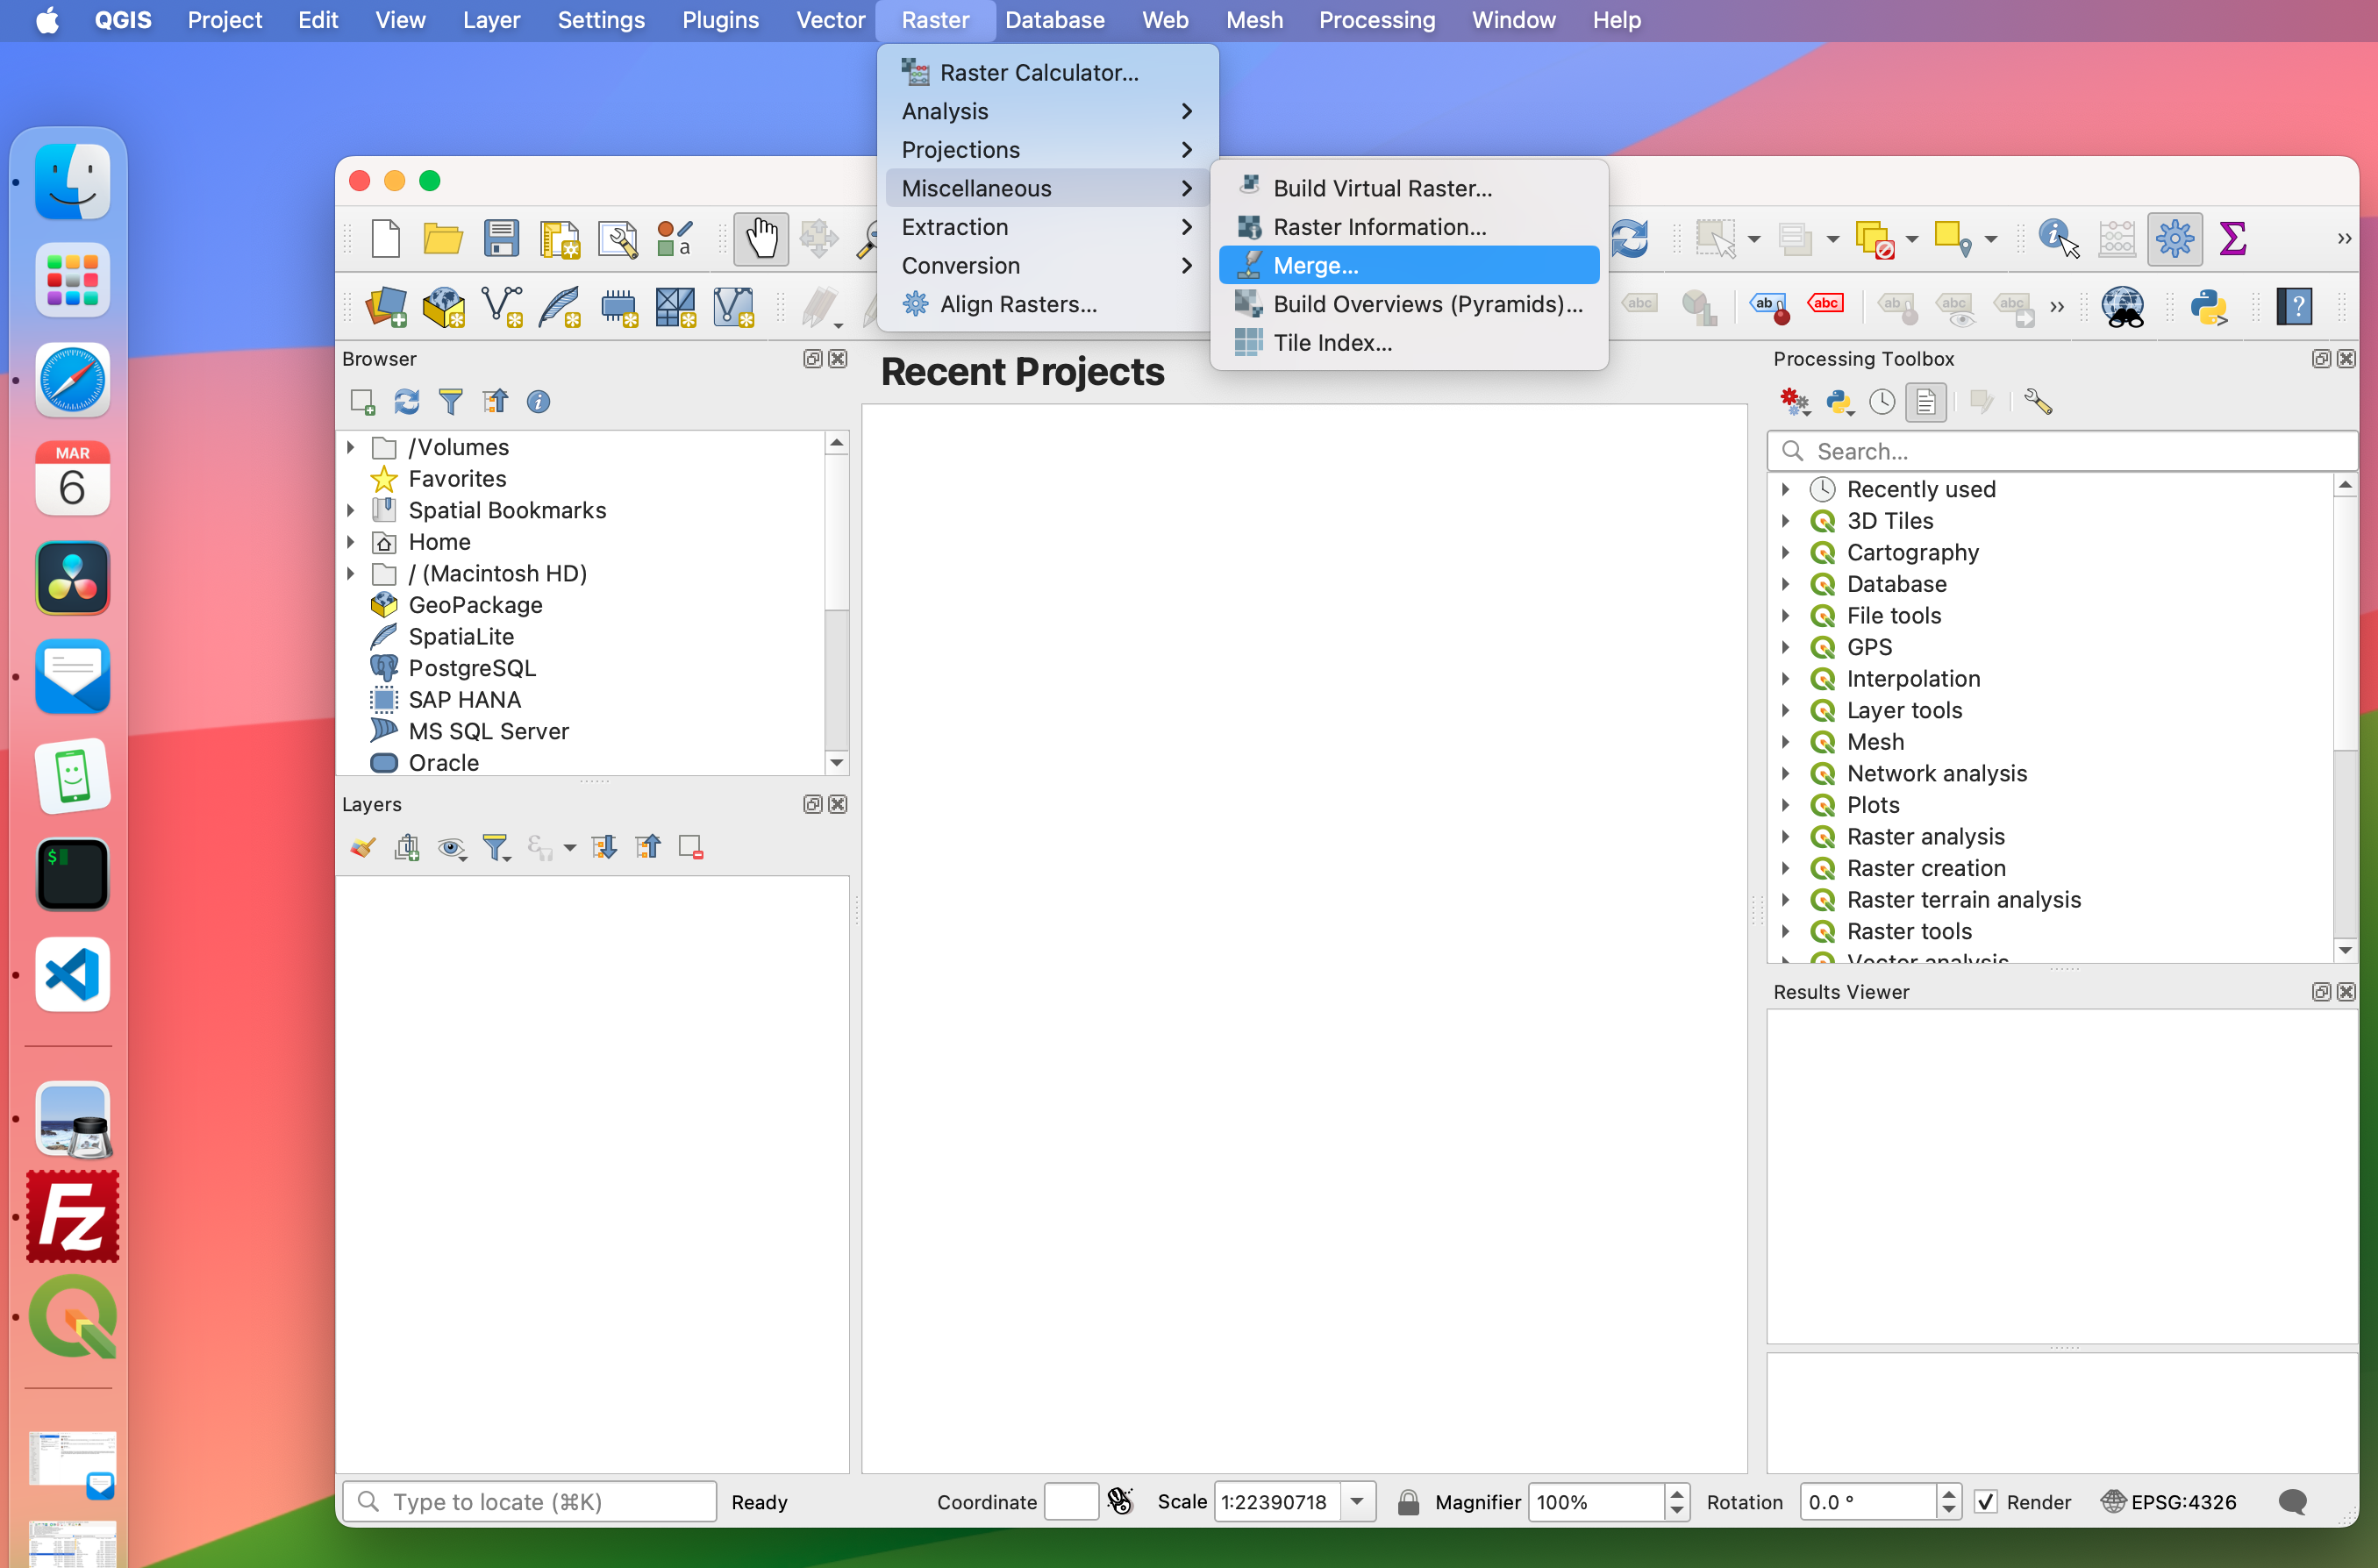
- Start by going to the Raster menu -> Miscellaneous -> Merge
- In the dialog that pops up, click the small button to the right of the Input Layers input then click Add Files(s)
- Browse to your unzipped GeoTIFF folder, order it by file type, then shift-select all the .tif files
- Hit OK (NOT Run—that comes later). You should now see "30 input(s) selected" or whatever your total number of selected GeoTIFF files was.
- Select the Output data type as Float32
- Scroll down to the Merged input, click the small button to the right and select Save to File. Choose tif as file type (the default) then supply a file name and location.
- At this point, the dialog box sometimes disappears behind the main QGIS window for some unknown reason. So move QGIS to reveal the box again, then tick the checkbox for open output file after running algorithm.
- Finally, hit Run to merge the files. You will see some proj.db errors, but you can ignore these as they are not relevant here.
- After a while (half a minute or so on a Mac mini M1 with 30 files to merge) the single merged file should appear as a new layer in the project canvas window, probably with some with some Coordinate Reference System (CRS) mismatch error messages along the top of the screen. You can now close the Merge dialog and close down all the CRS error messages.
Set up the Coordinate Reference System
It's crucial to get the CRS set up in a metric projection like the British National Grid. The project and layer values must be identical, so do this:
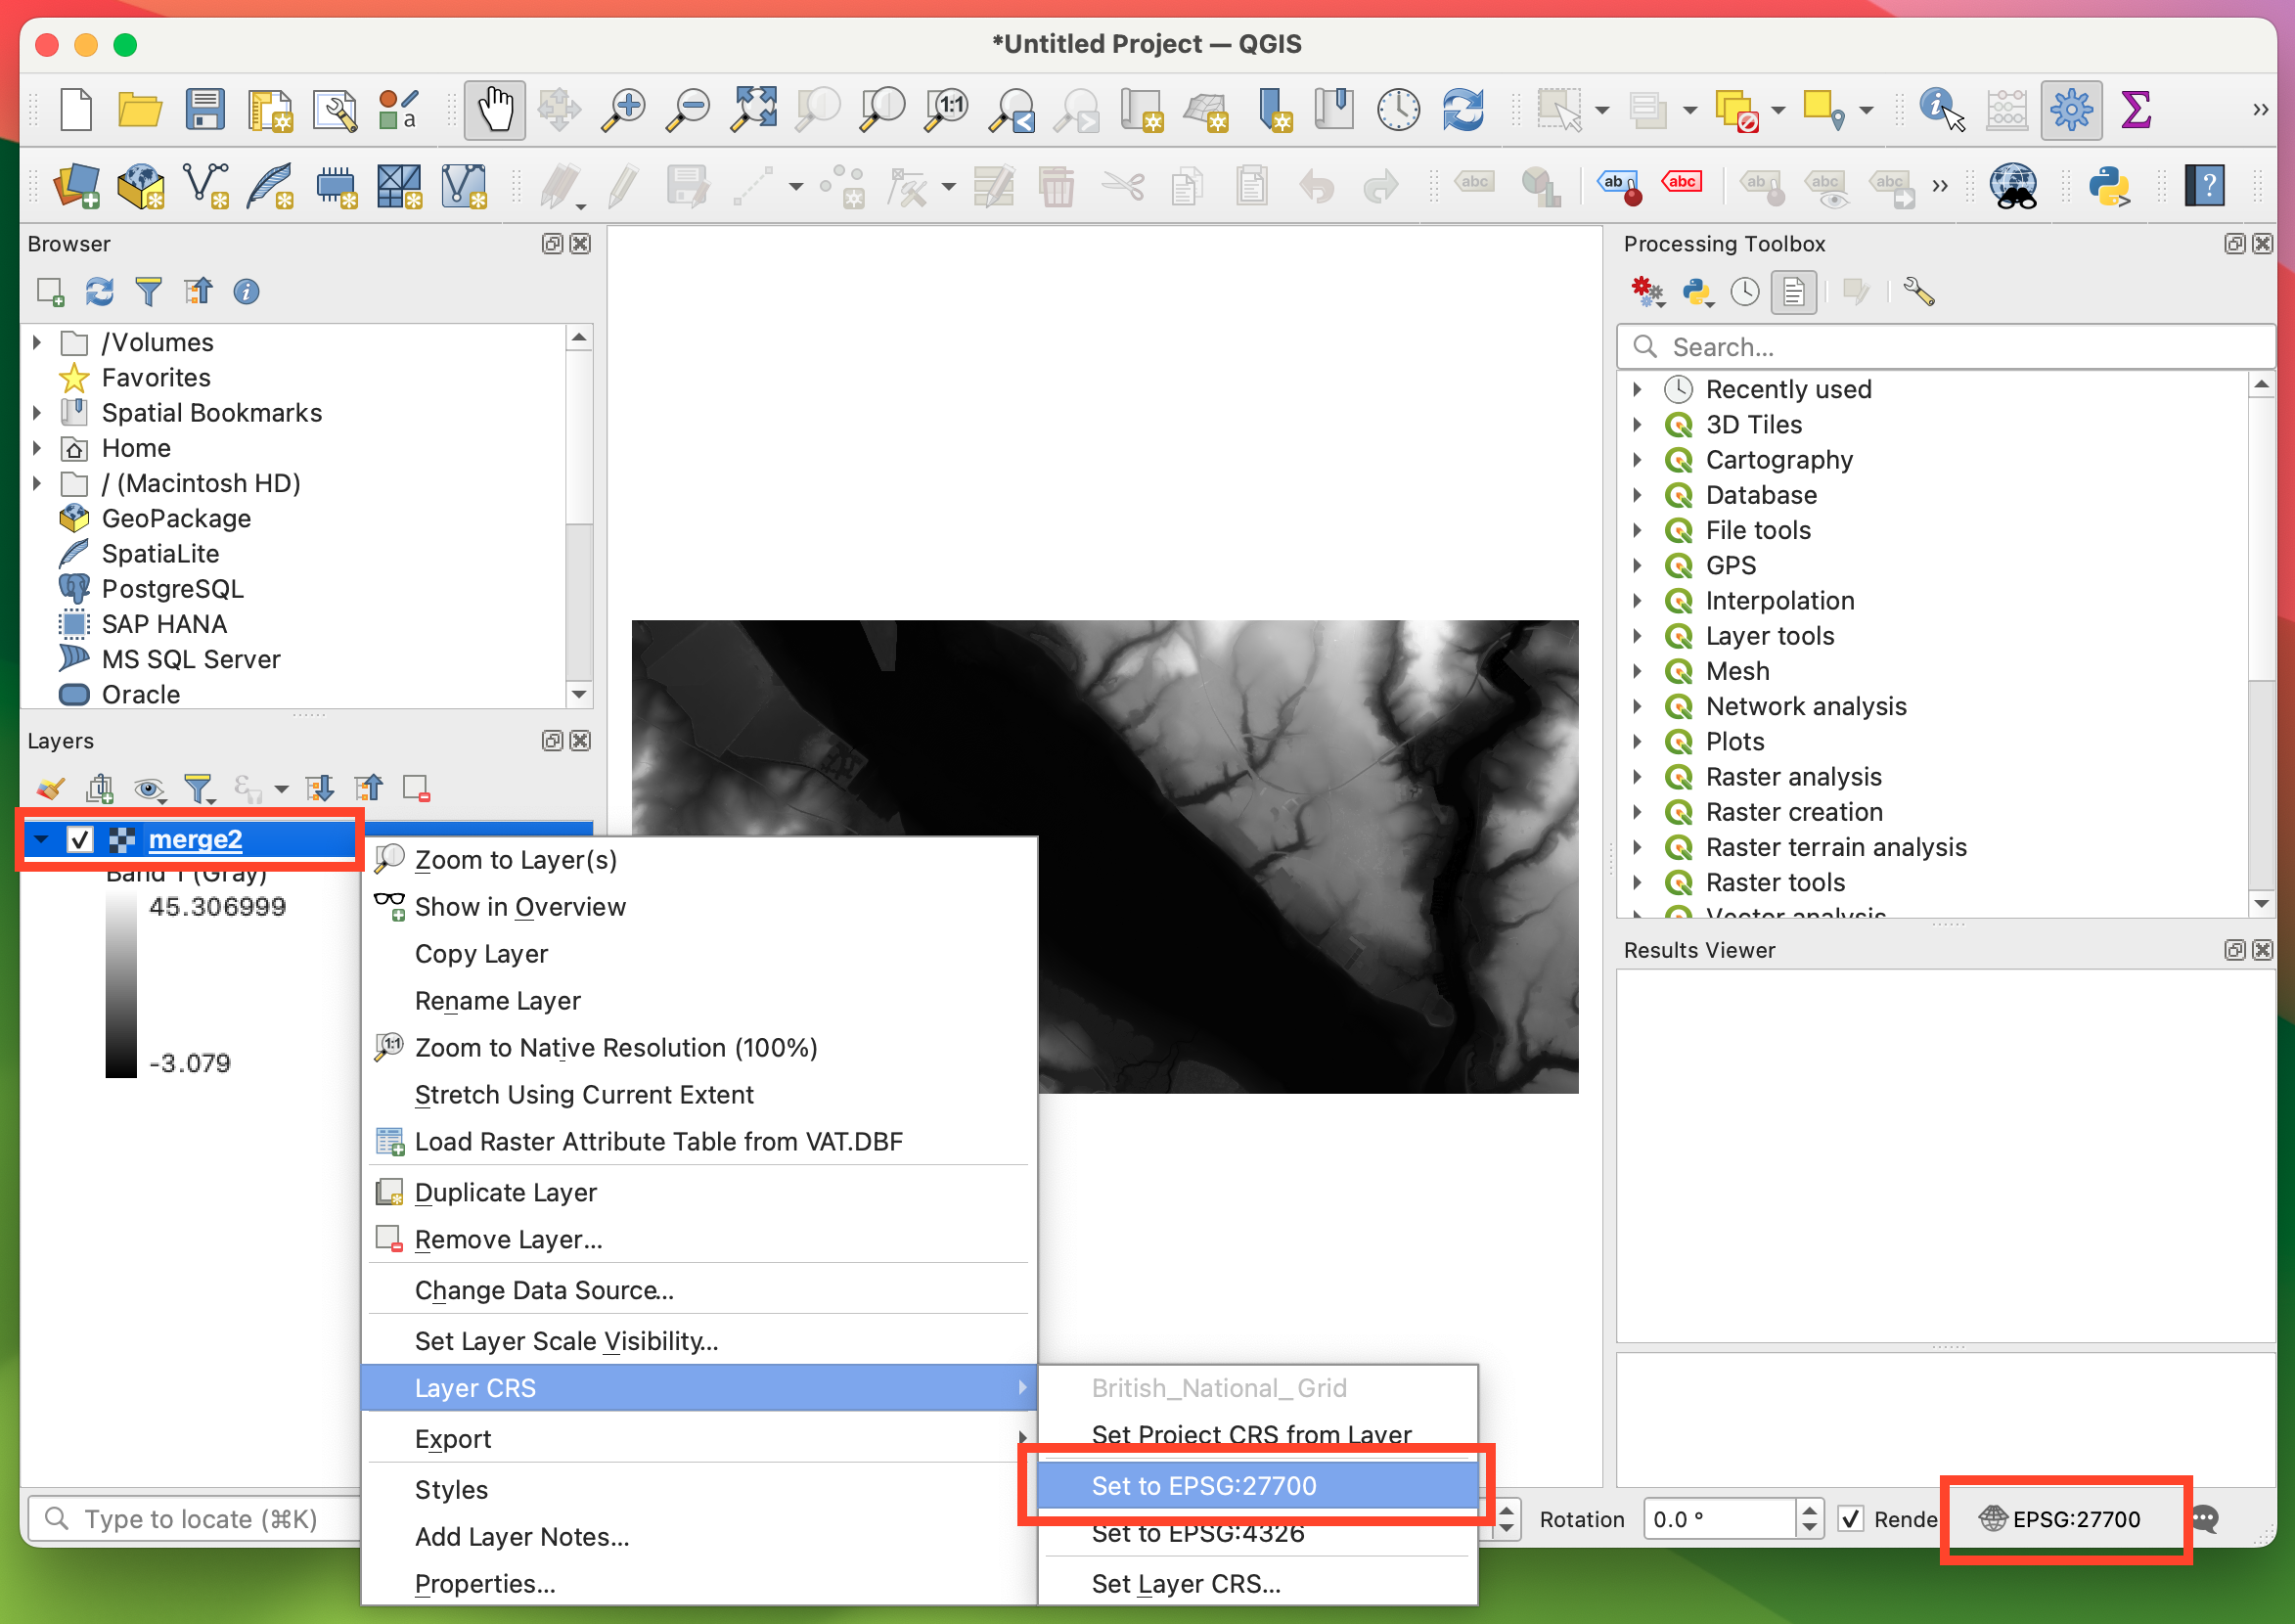
- Click the CRS box in the bottom right corner and select your CRS. For the UK, search for “OSGB” then select the option for OSGB36 / British National Grid | EPGS:27700, then hit OK.
- You should now see EPGS:27700 in the CRS box
- Click the new layer in the Layers panel at the bottom left to highlight it, then right-click the layer and in Layer CRS select EPGS: 27700 to ensure that your layer projection exactly matches the CRS box projection in the lower right corner of the main window
You should now be ready to add the hillshade effect.
Add the Hillshade to the merged GeoTIFF layer
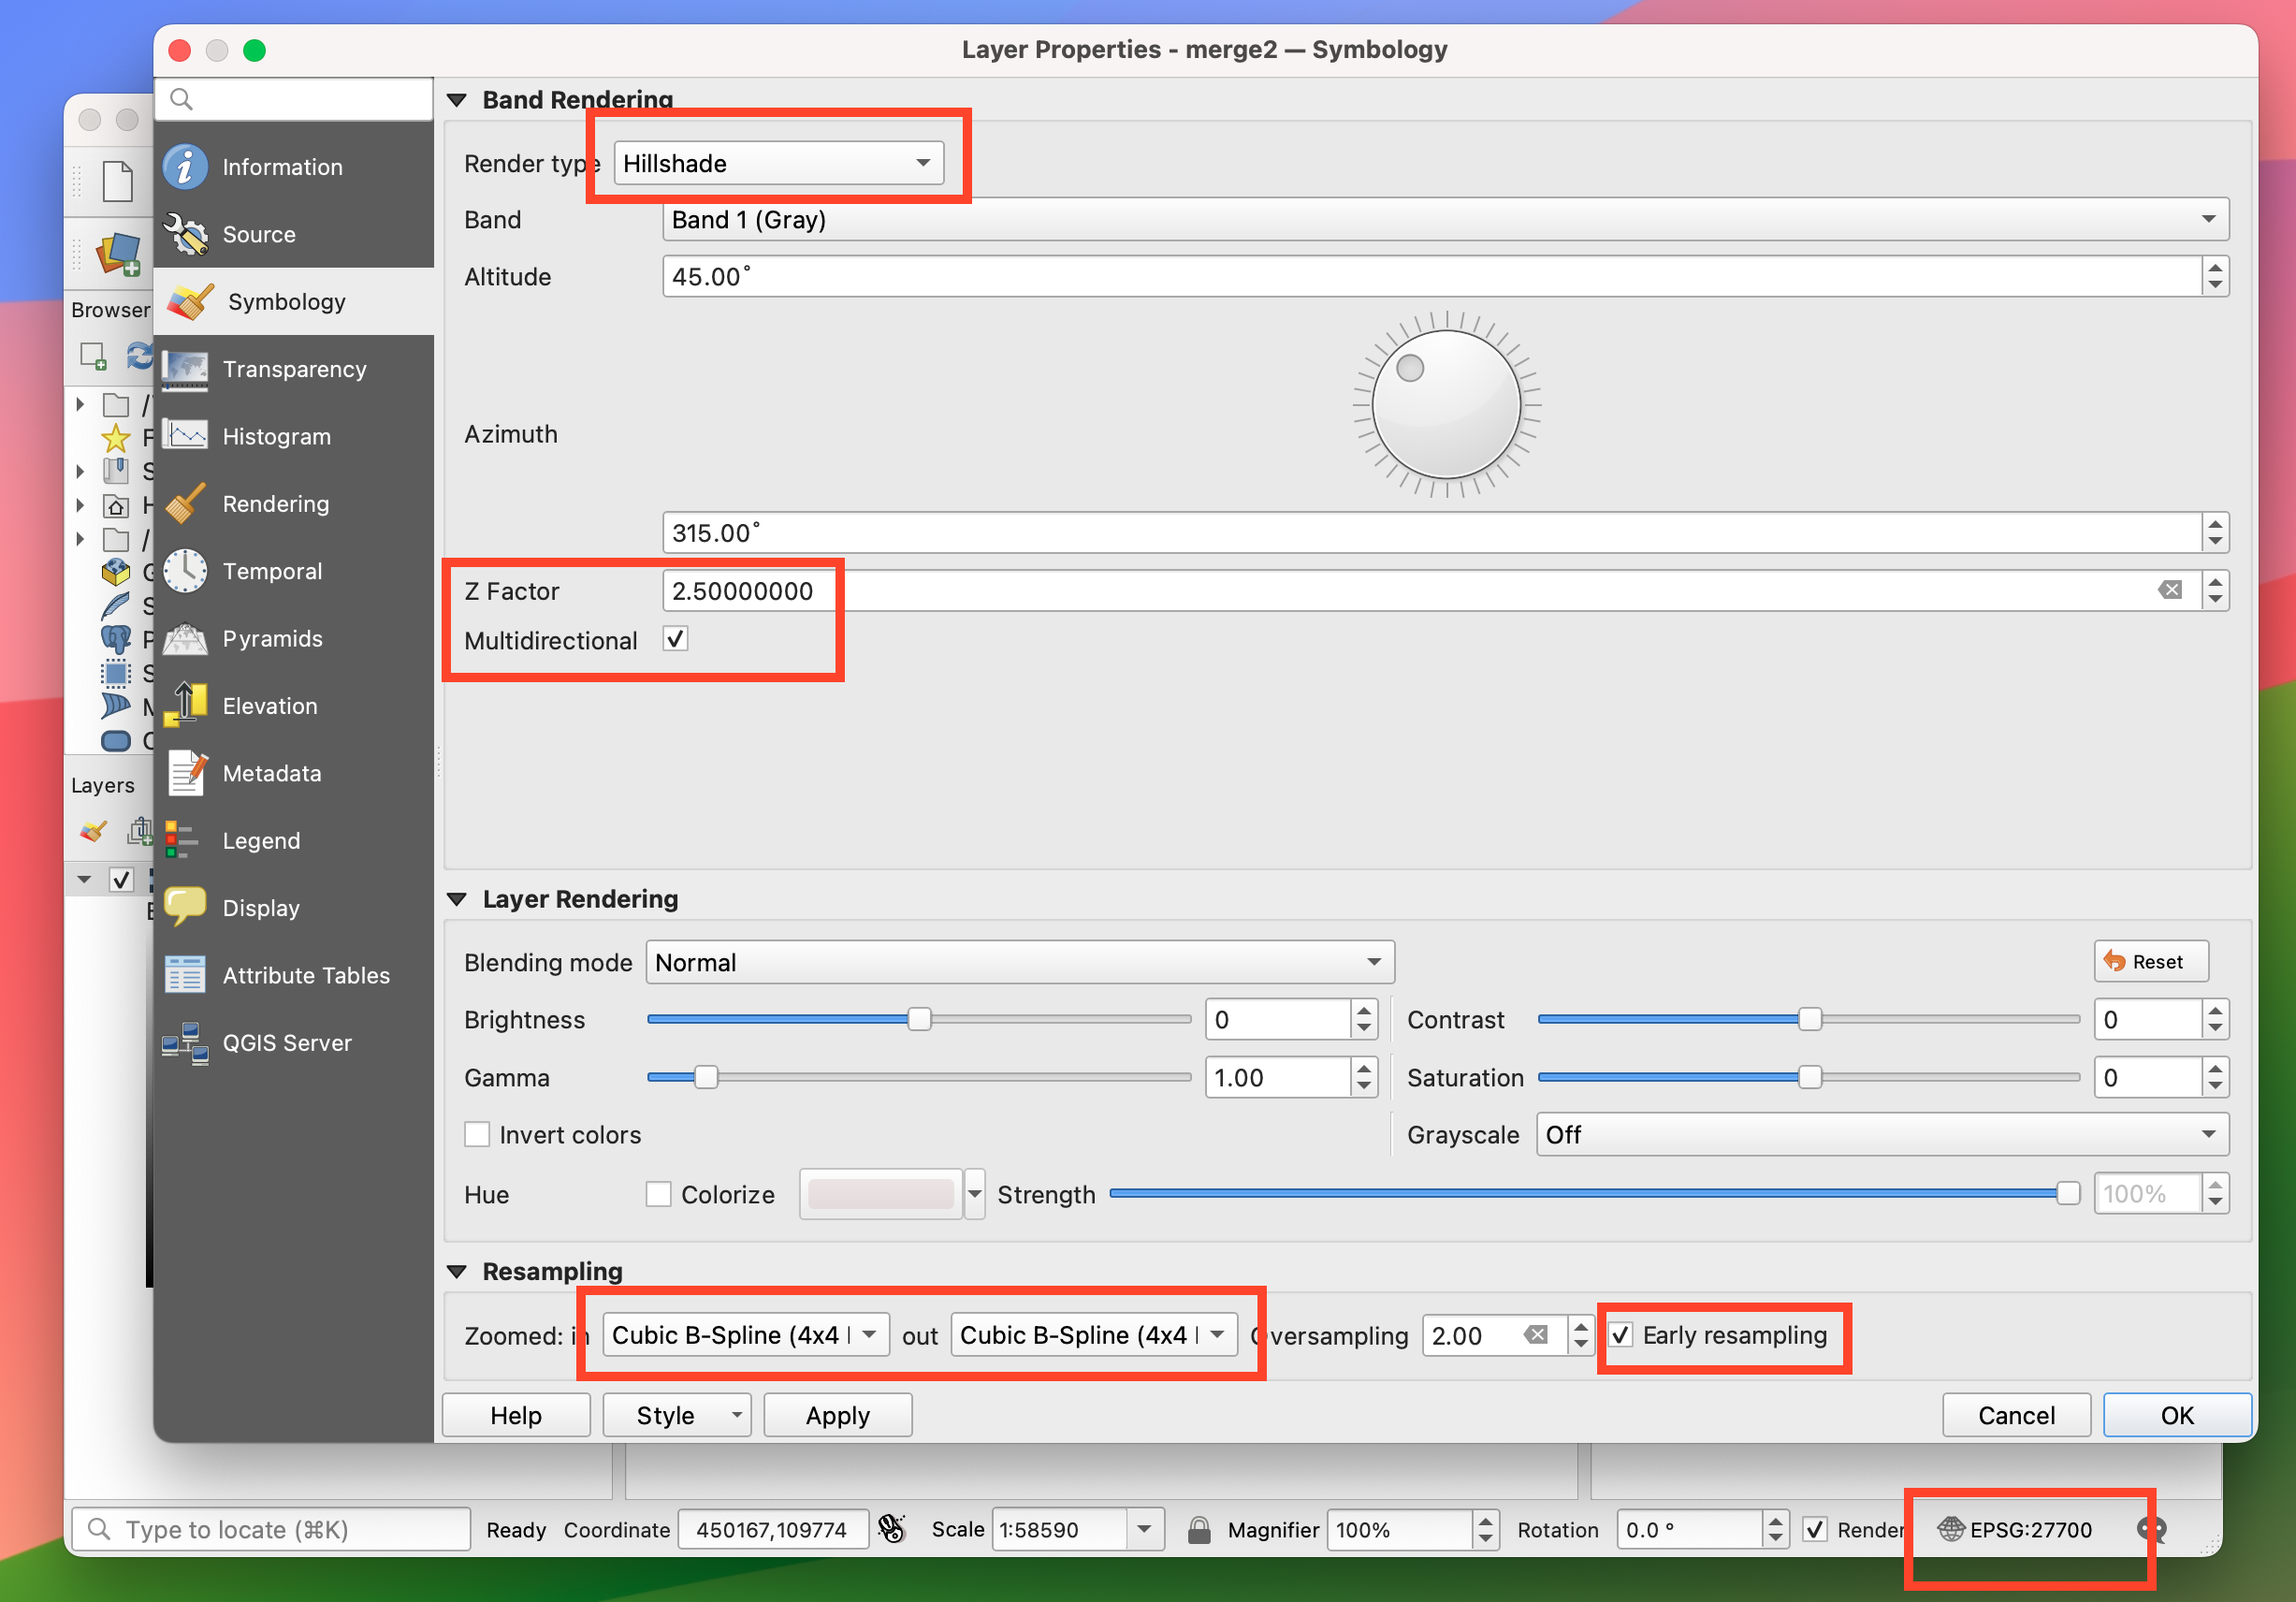
- Assuming your layer is still selected (i.e. highlighted), right-click it then select Properties -> Symbology
- For Render Type select Hillshade
- Leave Altitude and Azimuth at 45˚and 315˚ respectively (defaults)
- Set Z Factor to 2.5 (higher values give a more contrasty look)
- Tick the Multidirectional checkbox
- Leave all the Layer Rendering options at their defaults
- In Resampling, tick Early Resampling (this enables more zoom options)
- Then, for both zoomed in and out, select Cubic B-Spline (4x4 Kernel)
- Leave Oversampling at 2.0 (the default)
- Hit Apply then OK to close the dialog
You should now see the merged layer with a hillshade. Zoom in and check the settings above have created a satisfactory outcome. Some of the other zoom in/out options can produce crosshatch artefacts when zoomed in, so check carefully to ensure the layer looks good for your purposes. You can play around with the the settings here to get the look you want. The settings described above are what I ended up with after a lot of experimentation, but it's all personal choice to get the look you want.
Weirdness (bug?) work-around
Theoretically, you could now export from your hillshaded layer as XYZ map tiles. But I found that doing so creates unwanted fine crosshatch lines on the map tile files—even though none are visible in QGIS when fully zoomed in! Why this happens is a mystery, and possibly may not be a problem in later versions of QGIS (it certainly occurs in versions 3.34 and v3.36 though). Googling for crosshatch artefacts in QGIS reveals that the usual culprit for this problem is picking the wrong zoom type, but that is not the case here. The layer looks great in QGIS, but not when exported as map tiles :-(
So what to do? Luckily, after a considerable amount of experimentation, I found a work-around. You have to:
- export the hillshaded layer as a GeoTIFF file
- import that saved file back in as a new layer
- export the tiles from the new layer
This seems to work reliably. You do it like this:
- Right-click your hillshaded layer in the Layer panel and select Export -> Save As
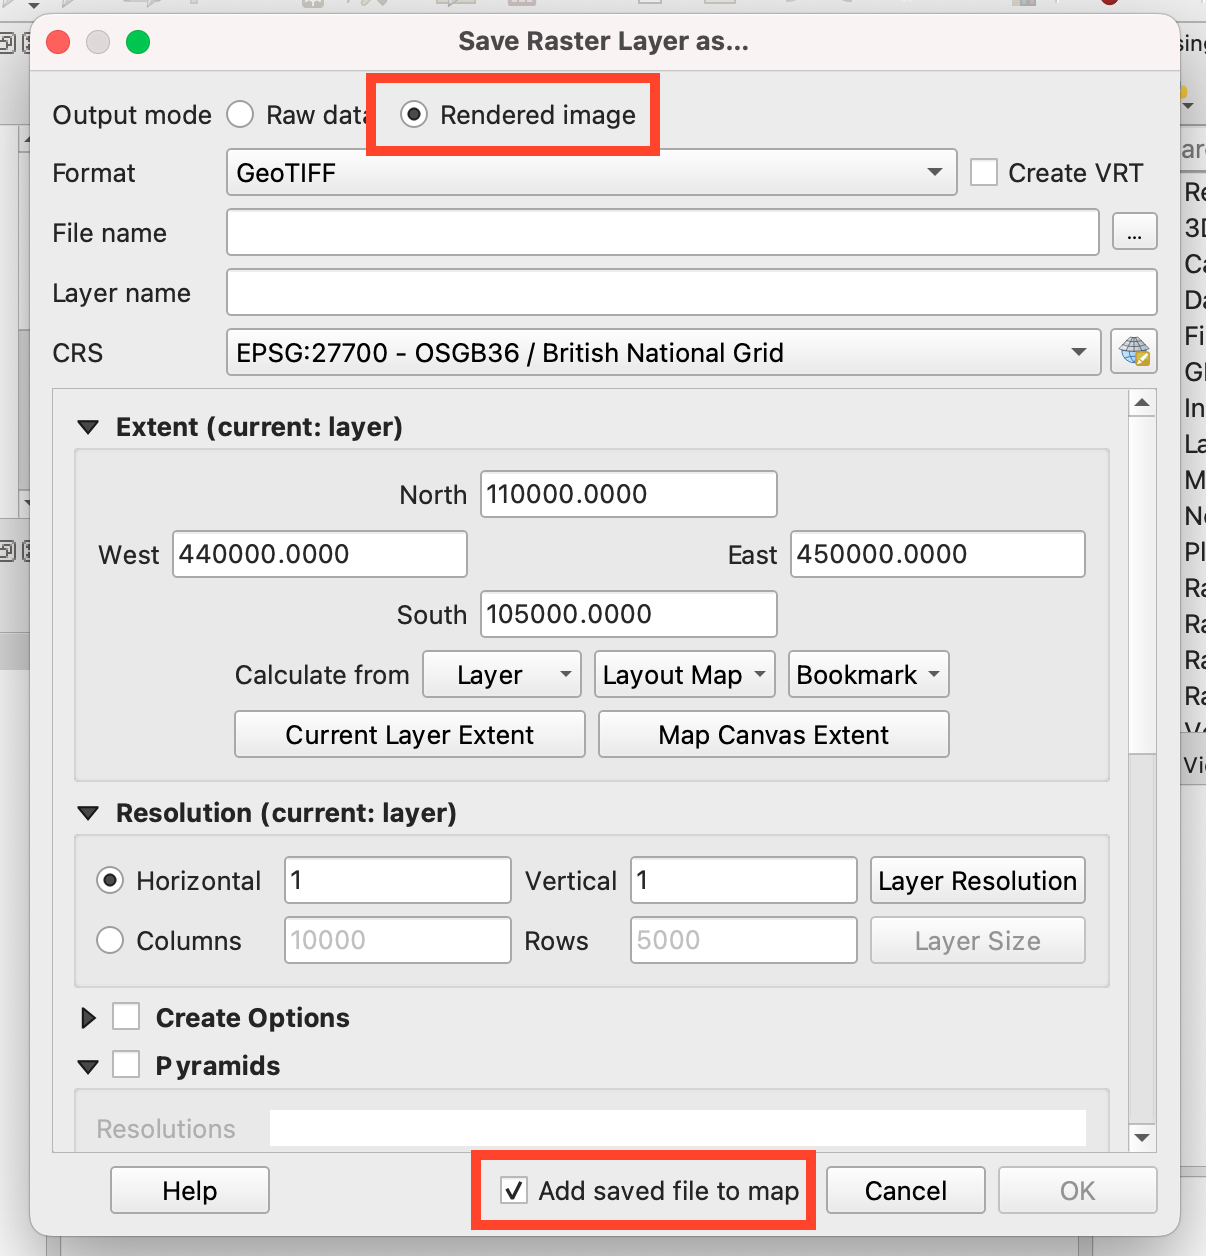
- In the dialog box, click the option for Rendered Image - this is an important step otherwise you will not see the hillshade!
- The format should be GeoTIFF (default)
- Select a file name and location
- Leave everything else at their defaults
- In the box footer, ensure Add saved file to map is ticked so that QGIS will automatically import the saved file as a new layer
- Hit OK then wait for the exported file to be created, after which it will appear as a new layer named as per your chosen file name
Sanity check
At this point, you might want to do a quick sanity check before trying to create the tiles. So go to the to the top left panel (the Browser panel) and do this:
- Open the XYZ Tiles drop-down and drag in a new OpenStreetMap layer
- Accept the default CRS conversion that pops up
- Drag the OpenStreetMap layer down the layers list so that it ends up at the bottom of the list
- Ensure the OSM and file layer you just created are ticked so that they display in the main window
You should now see something like this:
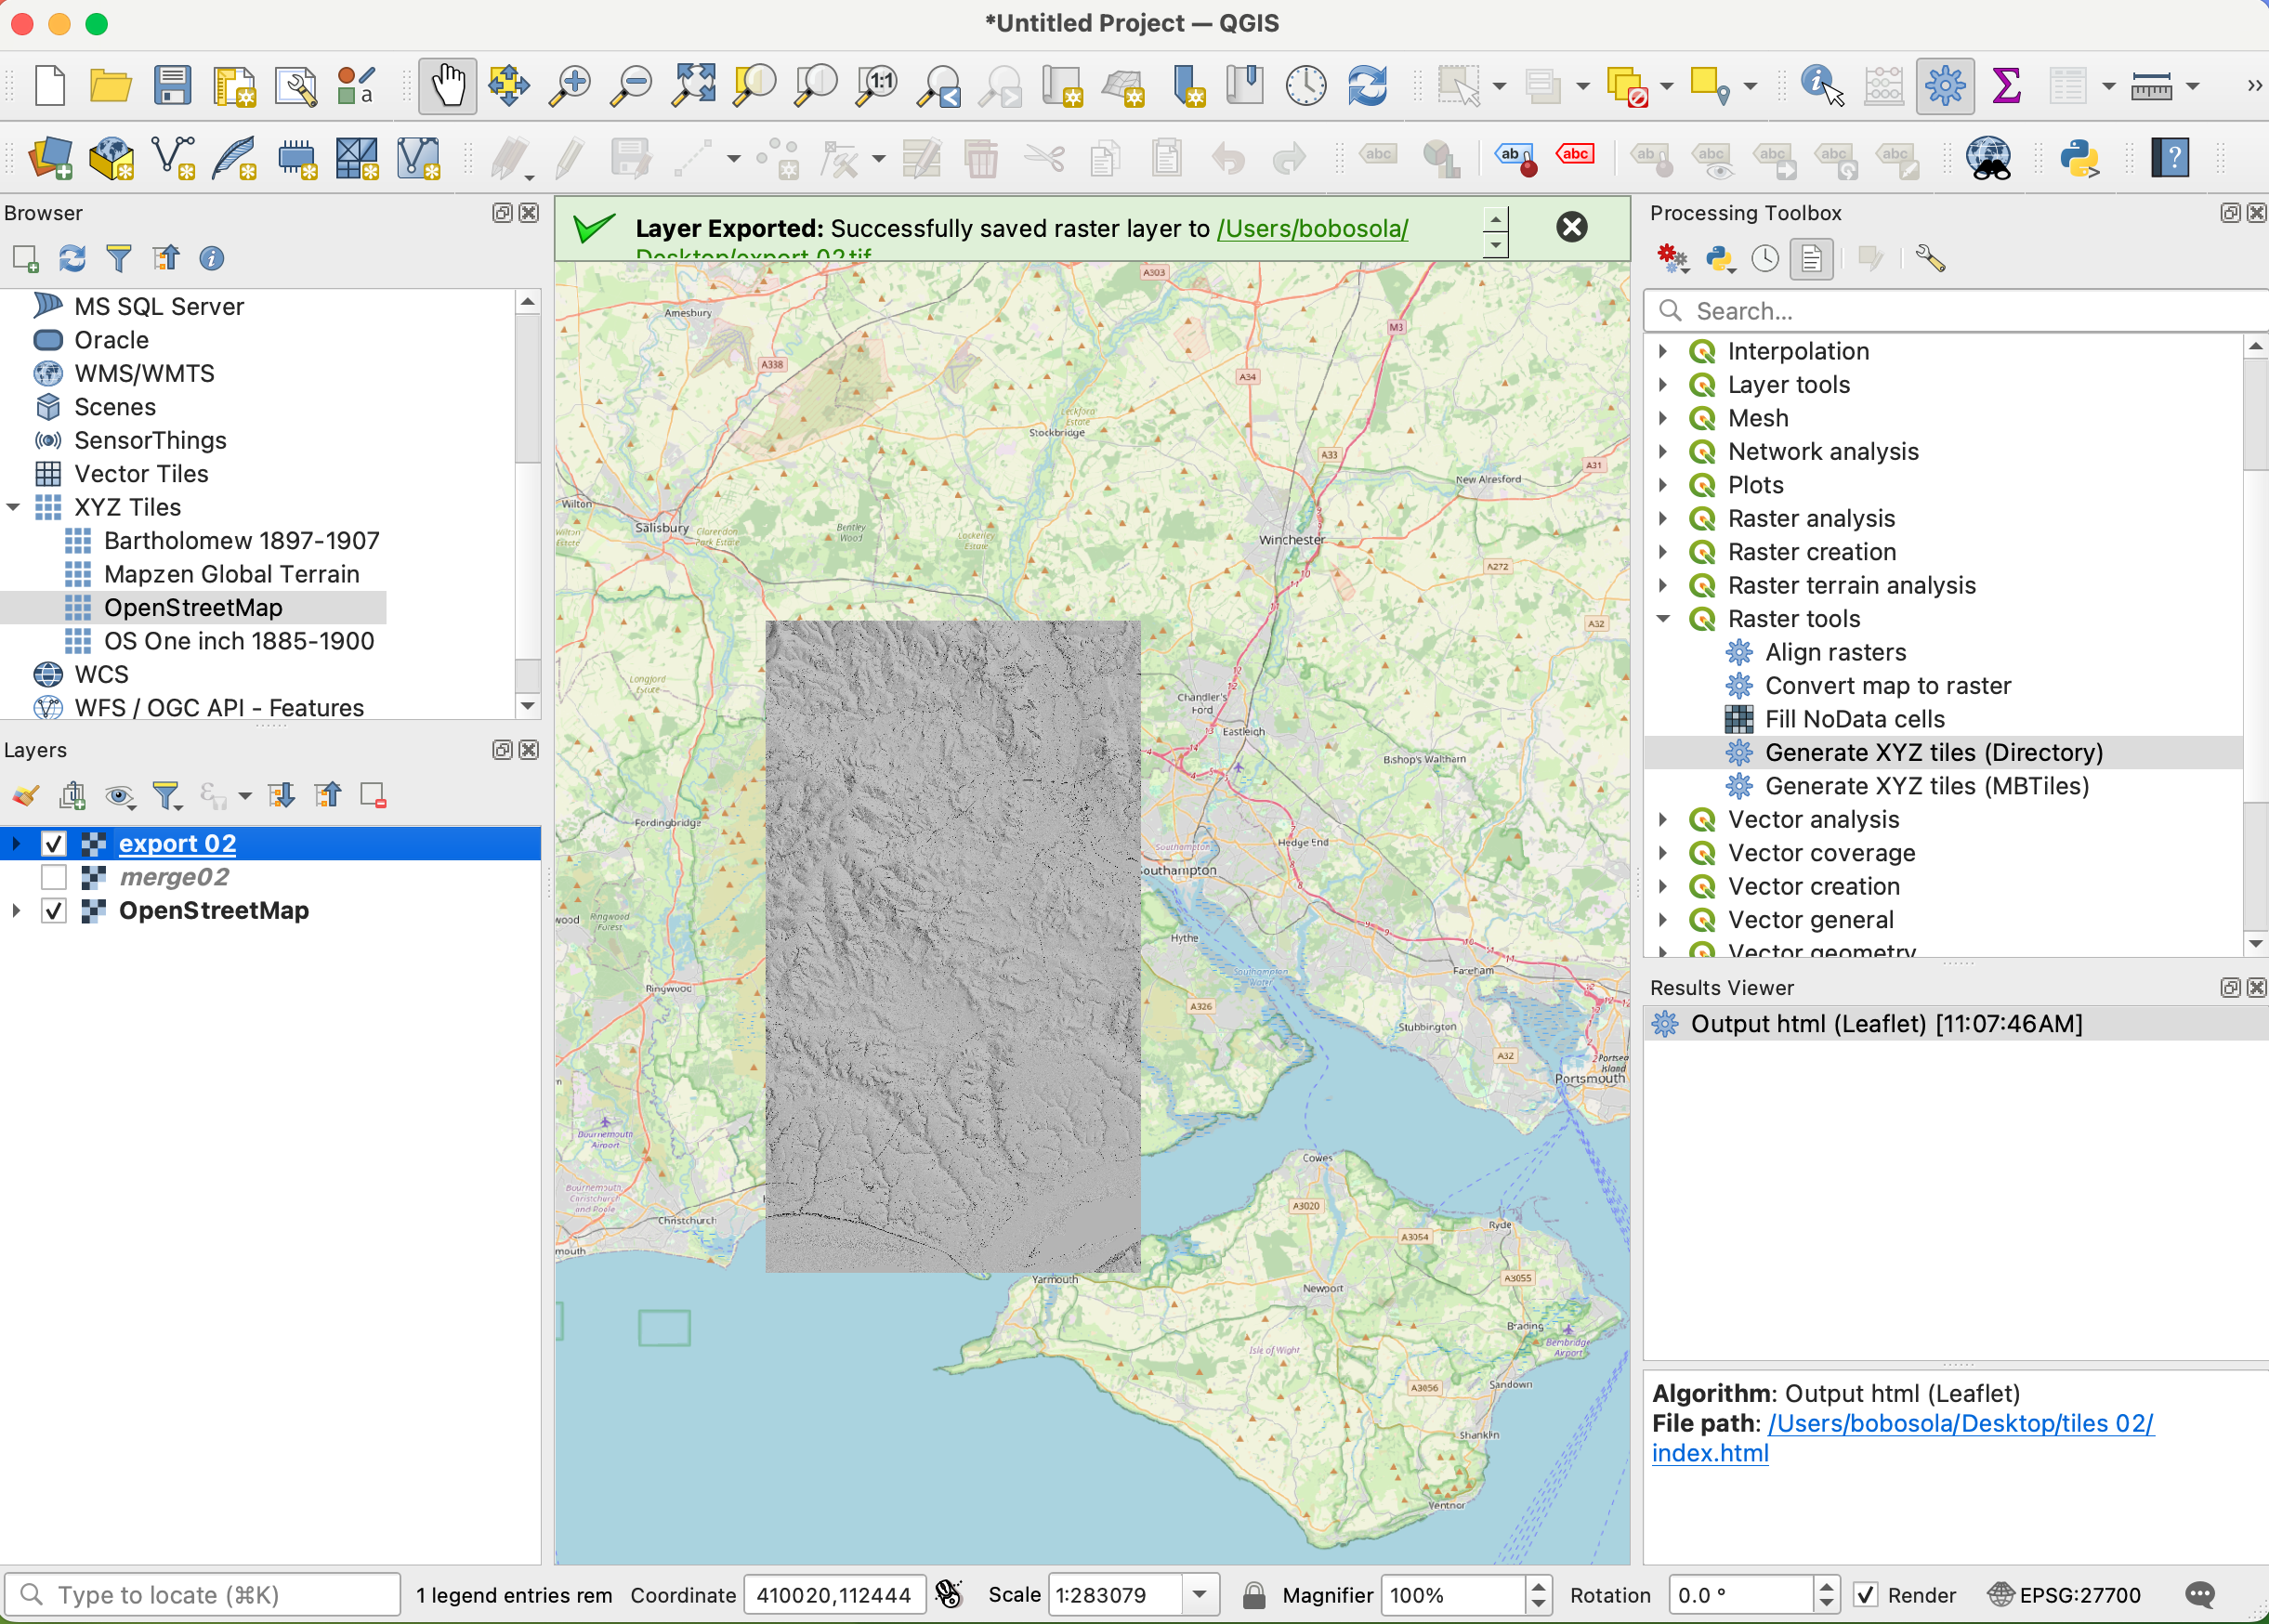
What you should see is your hillshade layer sitting exactly where it should be in the world on top of the OpenStreetMap layer. If not, you have some coordinate reference settings wrong somewhere.
Export as XYZ Tiles
Assuming the sanity check went OK, you can now select the exported file layer you created (i.e. highlight it) and untick all the others so that all you can see in the main window is your hillshade file layer.
Then do the following in the Processing Toolbox panel:
- Go to Raster Tools -> Generate XYZ (Directory)
- Set Extent by clicking the arrow to right of the box and choose Calculate from Layer, then select your current layer name
- Enter Minimum zoom as 8
- Enter Maximum zoom as 18
- Leave DPI at 96 (default), tile format PNG (default), and size as 256x256 (default)
- Scroll down and click the button to the right of Output directory, select Save to Directory and select wherever you want the tiles to go
- Then click the button to the right of Output html (Leaflet) [optional] and select Save to File. Then enter a filename to create a very handy HTML viewer file in the output directory which lets you check the tiles once they've been created.
- The dialog may then disappear behind the main window, so find it again, then hit Run, then wait. My Mac mini M1 takes around 5 minutes to prepare all the XYZ PNG tiles from a merge of 30 GeoTIFFs to cover an area 25km x 30km.
On completion, you can open the HTML viewing file in the output directory to view the tiles and check they are OK. This works fine locally, there's no need to upload anything anywhere.
If the tiles all look good, then check at maximum zoom levels to ensure they look how you want them to. If all has gone well, they should look exactly the same as your hillshade layer in QGIS. You can now delete the various intermediate files you made during the process.
Step 3: Implementing the map tiles in your site
The generated tiles should all be in your chosen output folder in sub-folders named from "8" to "18" (i.e. the minimum zoom level to the maximum). They can now all be copied to a tile directory on your website for use in the XYZ format as https://domain/tile-dir/z/x/y.png where z is the zoom level directory and x and y are the cartesian coordinate directories for locations within the map extent. An OpenLayers tile layer constructor example might be:
const LIDARlayer = new ol.layer.Tile({
   source: new ol.source.XYZ({
      attributions: [ "Bob's mighty tile layer" ],
      url: "/tiles/{z}/{x}/{y}.png",
      maxZoom: 18
   })
});
So a requested tile would be (say): /tiles/12/2033/1374.png, where OpenLayers substitutes actual values for the tiles it needs in the {z}, {x} and {y} placeholders. There is also an example on the OpenLayers Examples site of how to use an XYZ tile set.
You can also use your browser dev tools to look at my JavaScript map loader file while viewing a map (it's viewmap-yyyy-mm-dd-nn.js where nn is the current version number) to see how I'm using my XYZ tile set in OpenLayers here. This site is all written in plain vanilla JavaScript, CSS and HTML (no JavaScript frameworks or file bundling) so you can see exactly how I've done it. The JS is slightly complicated by using the ol-layerswitcher control, but it should be fairly clear what's going on, and it's heavily commented (not least to remind me how it all works in 6 months' time). You'll see a huge amount of JS files when using a browser dev tool to view the site sources—that's because I'm using import maps over HTTP/3 to efficiently pull in all the JS mapping and other dependencies rather than using a bundler tool. But the actual site JS files are pretty simple.
Protecting your tiles
This is a free site for anyone to use, so I'm very happy if anyone uses the code in whatever way they want, or better still, improves it and feeds the improvements back to me. But I have a limit on my web server bandwidth and therefore I cannot afford to allow others to request tiles from my site for use by their own sites (I would if I could). So I wanted a means to ensure my tiles could only be used by this site.
Instead of just having the tiles in a site directory on my server which can easily be accessed by anyone, I pass tile requests to a simple gatekeeper tile server written in a server-side language. It accepts the GET parameters for the {z}, {x} and {y} values for the required tiles. I can then check who is requesting the tiles and serve them from a private location.
However, reading and streaming files in a server-side language can be a bit costly on resources, especially if tile demand is likely to be high. Thankfully, Nginx has a better built-in approach: the X-Accel-Redirect feature (known as XSendfile in Apache). This is essentially a lightweight and very efficient means of serving private files directly from the web server without the need for reading and streaming in your code. I used PHP for this, but any server-side language will do, so long as it can:
- read GET parameters
- read the request headers
- add the X-Accel-Redirect and Content-Type headers to the output
Nginx sees the X-Accel-Redirect header in the output and re-directs internally to serve out the private file specified in the header. This gives you the dual benefits of efficient web server file caching and serving of the tile images, along with very low resource usage in your server-side language.
Here's my tileserver.php file. Even of you don't know any PHP it's simple enough to understand, and the comments describe how the X-Accel-Redirect works for this site:
<?php
/************************************************************************
  Serves private XYZ PNG tiles but only if the 'referer' header matches.
  (not secure but a cheap barrier against casual use by other sites)

  Uses nginx 'X-Accel-Redirect' header thus:
  The JS OpenLayers URL is:    /scripts/tileserver.php?z={z}&x={x}&y={y}
  This arrives here as (say):  /scripts/tileserver.php?z=12&x=2033&y=1374
  This is translated below to: /maptiles/12/2033/1374.png

  NB: '/maptiles' does not exist on the site, it's just an alias name
  used for the internal redirection. The alias URI is placed in the
  redirect header, which makes nginx do an internal redirect and deliver
  the file from /var/www/private/tiles/12/2033/1374.png

  This requires the following in the nginx site conf:
    location /maptiles {
        internal;
        alias /var/www/private/tiles;
    }

  See https://www.nginx.com/resources/wiki/start/topics/examples/x-accel/
************************************************************************/

// Test who is requesting the tiles
$liveSite = str_contains($_SERVER['HTTP_REFERER'], 'https://solentmaps.uk') ;
$testSite = str_contains($_SERVER['HTTP_REFERER'], 'http://localhost:8081');

// Set $maintenanceMode to true to serve a placeholder PNG with a suitable
// message during a period of tiles directory maintenance or repopulation
$maintenanceMode = false;

if ($liveSite || $testSite) {
  header('Content-Type: image/png');
  if ($liveSite) {
    if ($maintenanceMode) {
      header("X-Accel-Redirect: /maptiles/tilesdown.png");
    } else {
      // Fully working live site, so redirect to the private tile store
      header("X-Accel-Redirect: /maptiles/{$_GET['z']}/{$_GET['x']}/{$_GET['y']}.png");
    }
  } else {
      // Local test site, so just stream out the tiles from the site directory
      readfile("../tiles/{$_GET['z']}/{$_GET['x']}/{$_GET['y']}.png");
  }
}
else {
  // Disallow everyone else
  header('HTTP/1.0 403 Forbidden');
}
I am fully aware that the referer header is totally insecure and can be spoofed in hand-crafted HTTP requests using curl, netcat and the like, but it is one of the forbidden header names. That means that all browsers are designed to prevent any referer header changes in outgoing requests, including requests made in JavaScript. So the tiles should be safe from casual use by JavaScript mapping software on any other site, because the browser will ensure that any other site will send its own referer header with all client JavaScript requests. Such requests will be rejected by my tile server code when it reads the $_SERVER['HTTP_REFERER'] value (PHP makes all the request headers available in the predefined $_SERVER array in the format 'HTTP_n' where n is the header name).
To be clear: this is just a device to keep out casual attempts to access the tiles in order to keep within my data limits. I'll happily snail-mail over the 7.5GB of tiles on a USB stick or similar to whoever might want them. But if anyone can be bothered to write something using curl or whatever to download the tiles, then good luck to them—they've earned the right to use them as they see fit :-).
I'm always very happy to talk to site users and fellow developers, so please feel free to email me at bobosola@gmail.com if you have any questions.